A Tour of Your AgencyIQ Dashboard
Your dashboard is the first screen you see every morning. If it takes more than 15 seconds to read, it isn't doing its job. Here's a tour of every part of it.
In this guide:
- What each section of the dashboard shows
- How to read the 6 tiles at the top
- How to spot who's ahead and who's behind
- What the activity feed tells you
- How often it updates
Time to read: 5 minutes Best for: Owners, managers, and producers who want to know what to pay attention to first.
What are the main parts of the dashboard?
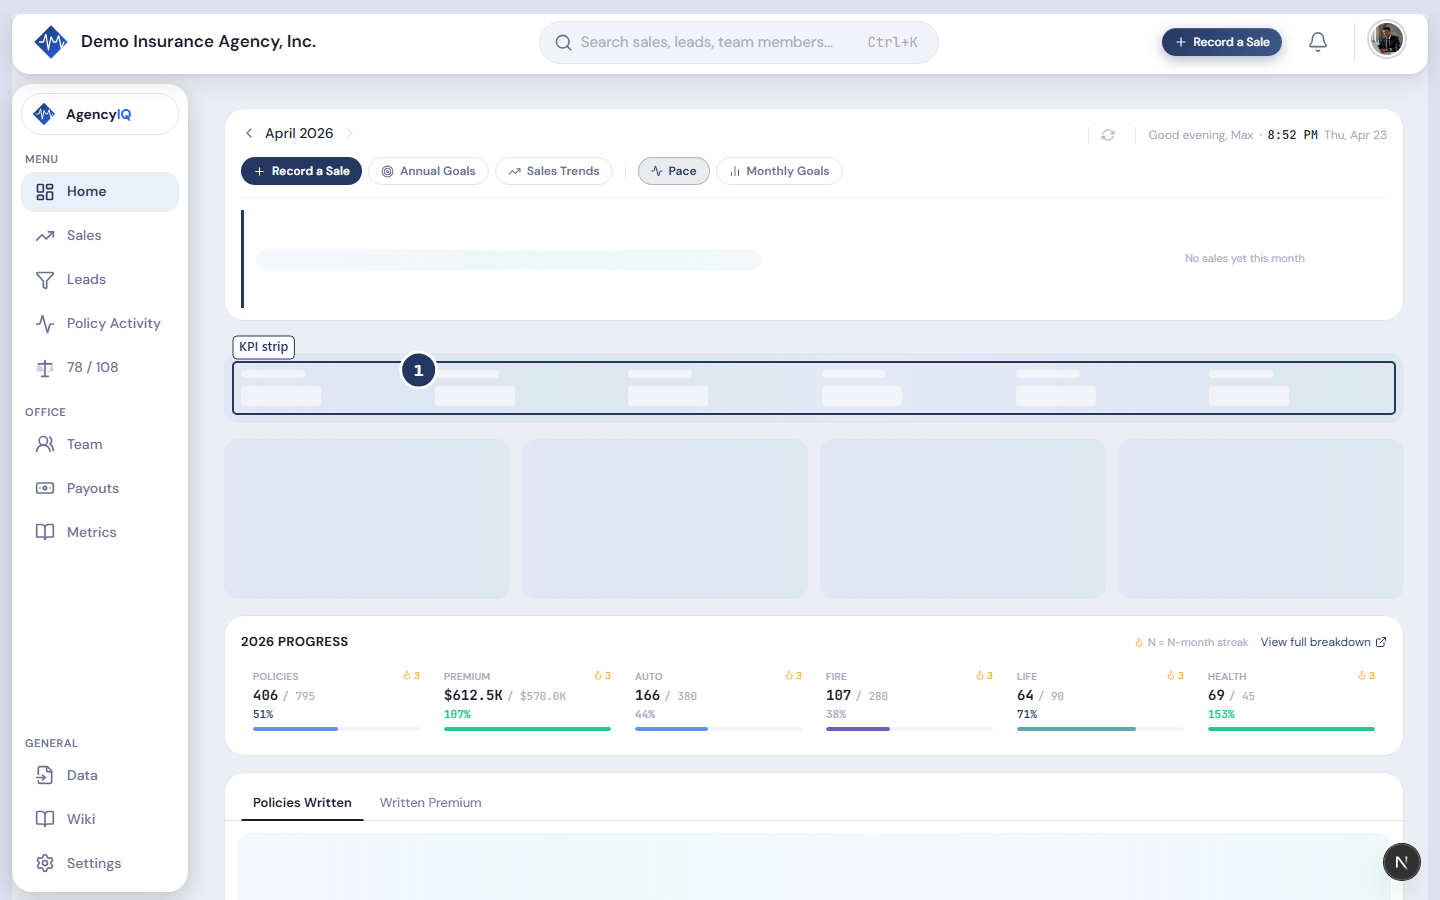
AgencyIQ's main dashboard is built out of 5 sections, stacked top to bottom:
| Section | What it shows |
|---|---|
| Header band | The month you're viewing + your pace for that month |
| 6 KPI tiles | Policies, Premium, Auto, Fire, Life, Health |
| Annual Progress strip | Your year-to-date progress toward yearly goals |
| Tabbed chart | Policies Written + Written Premium over time |
| Leaderboard + activity feed | Who's up, who's down, and what's happened lately |
How do I read the 6 KPI tiles?
Each tile shows a number, a goal, and how close you are to the goal.
There are 6 tiles across the top:
- Policies — how many policies you wrote this month
- Premium — total dollars of premium this month
- Auto — just the auto piece
- Fire — just the home/fire piece
- Life — just the life piece
- Health — just the health piece
Each tile has three parts:
- The big number (what you've done so far)
- A small goal underneath (what you're aiming at)
- A percent badge (how close you are)
Colors tell you how you're doing. Green means you're on or ahead of pace. Yellow means close but watch it. Red means behind.

What does the Annual Progress strip show?
A 6-month preview of where you are on the year.
The strip shows your last few months plus your streak. You'll see a little icon if you're on a hot streak (green) or if you're cooling off.
Click View full breakdown → to open the Annual Goals window. That window shows every month of the year side by side, so you can see exactly where you are.

How do I read the tabbed chart?
Below the KPIs is a single chart with two tabs:
- Policies Written — the count of policies over time
- Written Premium — the dollar amount over time
Click a tab to switch views. The chart shows your last 12 months by default. You can change the date range with the picker in the top-right.

Click any bar to see the detail. You'll drop into a list of every policy that made up that month — who wrote it, which carrier, and how much premium.
What's the leaderboard for?
It ranks every producer by what they've written this month.
The producer at the top of the leaderboard earns the "Leader of the Month" callout banner at the top. The board is the fastest way to see who's carrying the team, who's having a quiet week, and who's right on the edge.

Two things to look for
- A producer high on the leaderboard but behind on their own goal. Their number looks big because their goal is big. They're actually behind.
- A producer low on the leaderboard but ahead of their own goal. Their goal is small, so they look low — but they're winning their own race.
Switch the board from "Rank by Premium" to "Rank by Goal %" to see both views.
What's in the activity feed?
A running list of what's happened in your agency.
You'll see things like:
- 📤 A sales file was just uploaded
- 💰 A pay run was posted
- 🎯 A producer just hit 75% of their monthly goal
- 👤 A new team member was invited
- 📞 Lead data was imported

This is your agency's heartbeat. A quiet week is quiet. A busy week is full. Ops managers keep this tab open all day.
How often does the dashboard update?
Every time you refresh — no overnight batch, no cache warning.
If you upload a new sales file at 2:15 PM, the dashboard reflects it by 2:16 PM. That matters in the last week of the month when a handful of new policies can swing your percent-to-goal by 10 points or more.
Does the dashboard look different for producers vs. owners?
Yes — and on purpose.
| Viewer | What they see |
|---|---|
| Owner or Manager | The whole dashboard — everyone's numbers, everyone's pay |
| Producer | Their own numbers, their own goals, and the leaderboard (ranks only, no dollars for teammates) |
| Service / CSR | Production numbers for coaching — no pay numbers |
Why the split? Transparency into your own numbers helps accountability. Visibility into teammates' pay creates drama. AgencyIQ splits those cleanly.
Frequently Asked Questions
Can I pick and choose which widgets to show?
Not today. The dashboard is on purpose opinionated — these are the things we think every agency owner should see every day. Custom drag-and-drop layouts are planned for later.
What if my agency writes commercial lines?
Commercial shows on the Premium tile and on the chart. Agencies that write mostly personal lines see Auto, Fire, Life, Health tiles as the main drivers. Mostly commercial agencies will see some tiles light and some heavy.
Why is last week's data missing from my dashboard?
Most likely you haven't uploaded last week's sales yet. Or, if your file uploaded, the dates in your file might be wrong. Open the Sales Log and filter by last week to check.
Can I see the dashboard on my phone?
Yes. The mobile layout stacks the sections on top of each other. Most owners check mobile between appointments or at lunch.
Can I share my dashboard with my accountant?
Not as a live link — not yet. For now, export a PDF (click the Export button) and email that. See How to Export a PDF Report.
Stop opening five tabs to see how the agency is doing
AgencyIQ is free during beta for Founding Members. Get every number on one screen, updated the second your team enters it.
Founding Members get grandfathered pricing when we launch paid tiers later this year.
Last updated: 2026-04-18